March was the 7th month for Apes in Space, my space posters store.
February was the biggest month yet (grossing $1,340), but profitability was hurting A LOT.
So while it would have been nice to report another $1,000+ month, I knew I had to make some drastic cost cuts . So without the support of the ads, I knew March was going to be a lot less eventful 😅
That said, there was plenty of interesting stuff happening! Here is everything that happened in March 2018 divided up into the following areas: Marketing, Financials, Merchandise, Effort & Psychology.
👉 By December 2018, I want this online store to consistently hit $1,000 / month in revenue. Sign up for new updates and follow the journey!
You can also watch the video update:
📈 Marketing
Stats
Total number of sessions: 586 (-91% compared to February)
The number of sessions dropped sharply:
Next, let’s look at the quality of these visitors: Pages/Session, Avg. Session Duration & Bounce rate.
These have all improved. Mainly because there was a lot less traffic from (Facebook) ads. This is often a lot of drive-by traffic.
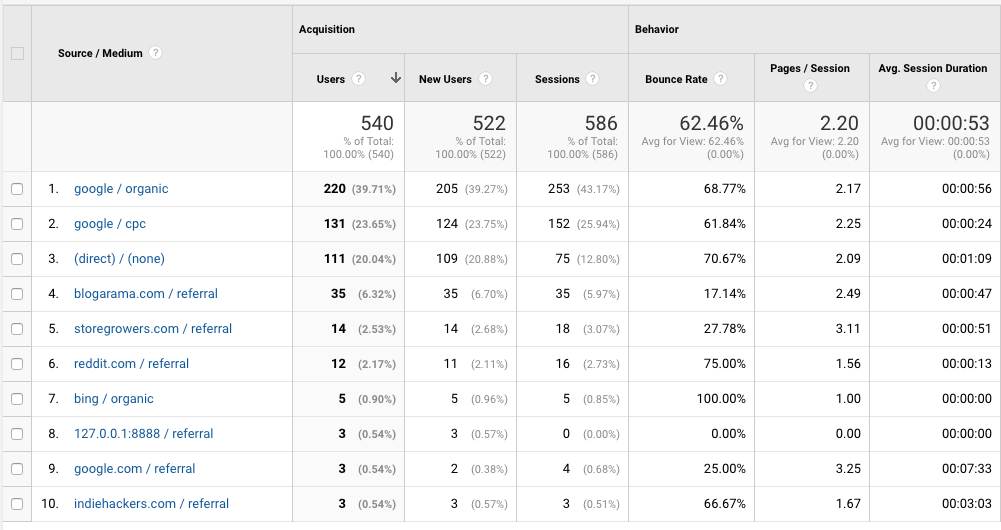
Next let’s look at where the visitors in March came from:
Organic traffic from Google tops the charts. Next is the traffic from Google Adwords campaigns. Note that the session duration for organic traffic is more than double that of the paid search traffic. That’s because most ad campaigns land on a category or product page while most of the organic traffic comes in on the blog.
Other notable traffic sources are the mixed big of direct traffic, and a couple of referrals: blogorama, this site, reddit and Indiehackers.
SEO
My core traffic strategy remains:
- Limited ads for short term gains (improve website, create email funnel, make some sales)
- Organic search in the long term
Organic search is currently powered by the products on the site (the Starman posters continue to be a hit) and the blog content.
I managed to put out 5 new blog articles. That’s almost the 6 posts that I had planned. This doesn’t seem much, but after a very poor January and February when it came to new articles, I’ml happy I got some stuff out.
April is a pretty eventful month, there are 11 articles on the content calendar.
Like I said, I’m counting on organic traffic for the long term. We’re seven months in, and the SEO is slowly starting to kick-in. And as the traffic sources report shows, organic traffic is the main traffic driver. That said, 220 visitors/month isn’t going to break the bank.
So it’s clear that I’ll need to do something on top of writing articles.
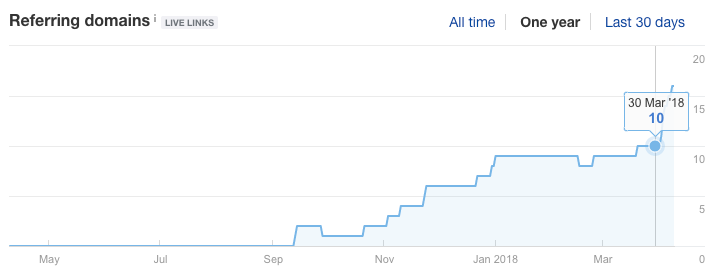
That includes getting more backlinks. I currently have only a few referring domains to Apes In Space:

Referring domains to apesinspace.co – Ahrefs
Some of the smaller sites that sell space posters also have 10-20 domains linking to it. So I can probably already outrank them with the links I have.
The real competition is from the giants that dominate any poster related search, a site like allposters.com for example has links from 99 DA sites 😛 So it’s clear that these are currently out of my league.
What will happen if I manage to get more links is that all the blog content will get more visibility. And that will help the whole site.
During April, I’ll explore a couple of ways to increase the number of backlinks.
Email marketing
There is still a popup in place to capture the email addresses from site visitors.
Here are the results for March:
- 241 views
- 2 signups
- 0.83% conversion rate
Besides these popups, the email list also grew through orders and a few other optins. Total email subscribers is now at 76 (+3 vs February).
I still need to put together the automated email campaigns in Klaviyo that I’ve been talking about for the last couple of months.
Google Adwords
Adwords campaigns have been up and running for about two months.
Those campaigns brought in 13 sales in February, but they were unprofitable overall. For each $1 that I spent, I only made back$0.6 in revenue.
In order to justify spending money on these campaigns, I need to at least break even on them, which means making $1.5 for every $1 that I spend on ads.
To accomplish this, I need to invest more time into the campaigns: limiting the number of keywords and lower the cost per click drastically.
I didn’t have the time required to do that, so the campaigns have been paused since the second half of the month.
Here is the breakdown of the campaigns:
- Clicks: 151
- Cost per click: $0.45
- Cost: $68.44
- Orders: 1
- Conversion rate: 0.66%
- Revenue: $28.95
- AOV: $28.95
- ROAS: 0.4
Plan for April is to make those tweaks so the traffic starts flowing again, and to launch Google Shopping ads to see how they perform.
Social media follower counts
- Apes In Space Twitter: 51 followers (-1 vs February)
- Apes In Space Instagram: 47 followers (+3)
- Apes In Space Facebook: 243 likes (-1)
💰 Financials
As I indicated in the report, I tried to make the store a lot leaner this month.
Here is what the financials for March look like:
Detailed breakdown:
Revenue: $204.30
5 orders totalling $204.30
Expenses: $234.57
- Printful product, logistics and taxes: $103.23
- Shopify basic plan: $29
- Shopify transaction fees: $5.90
- Stripe transaction fees: $4
- Google Adwords spend: $68.44
- Privy: $24
Profit / loss = Revenue – Cost = -$30.27
The store is still turning a loss, but it is already an improvement over February.
In April, I’ve also cancelled the Privy app and cut the ad spend. That should save almost $100, the difference between breaking even.
📦 Merchandise
I added 14 new posters to the store in March, the total is now at 100 posters 🎉
Since the SpaceX posters are pretty popular, I decided to a lot more of them.
Besides the organic search from the blog, the products and collections are also starting to climb in the search results. So adding more of them, will naturally lead to higher sales.
In April I’ve got one big event planned, and that will require adding a whole new category of posters to the store. So I hope to add around 50 posters to the store in the coming month.
⏱ Effort
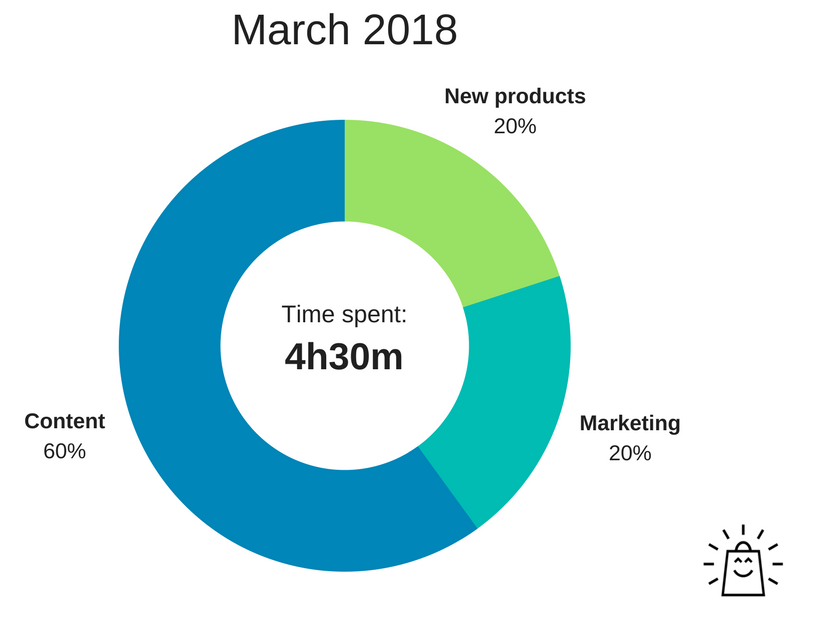
Here is how much time I spent running my online store in March:
I spent about half as much time on the store during March as I did during February. And most of that time was related to writing new content.
😶 Psychology
As I mentioned in the intro, February was a huge month with regards to sales. But putting the report together and seeing the loss kind of bummed me out.
That in combination with a lot of other projects, made it hard to really put a lot effort into the store.
Writing this report (and comparing against last month) shows all the things I have on my to-do list, but that I’m not getting to.
To keep it interesting for me and for all of you following along, I need to invest at least 10 hours a month into the store. Otherwise not enough happens in between updates. Broken down that’s about 30 minutes per work day, which is pretty manageable.
So consider it a promise 😉
That’s it! If you found this post valuable, please send it to someone else that could benefit from this. I really appreciate any help I can get!
Bonus
🚀 My goal is to consistently hit $1,000 / month in sales by end of December 2018. That’s only 9 updates away so be sure to sign up for future updates to follow the progress!
Other updates in this series: Launch – Month 1 – Month 2 – Month 3 – Month 4 – Month 5 – Month 6.


